RESPONSES TO AN ORMUS PREPARATION,
AND TO SINGLET OXYGEN THERAPY,
AS SHOWN BY A COMPUTERISED KIRLIAN TECHNIQUE
by Dr. Roger Taylor


This technique, called Gas-Discharge Visualisation (GDV), was developed by Dr Konstantin Korotkov of St. Petersburg (see  websites http://www.kti.spb.ru in Russia, and http://www.gdvresearch.com in the US). The fingers are placed individually on a glass electrode, to which is supplied a high voltage high frequency pulse. Light from the resulting electric discharge through the air around the finger is picked up by a CCD camera, and the digitised image sent to the computer. Immediately below are examples of the images which are sent to the computer.

Kirilian image of fingers

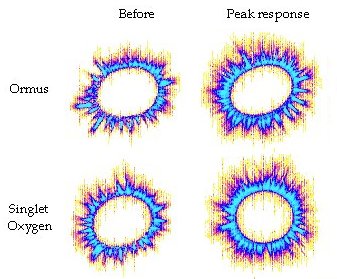
The image above shows the change in a single finger after (a) ormus, and
(b) singlet oxygen. What is mainly evident is the change in area; the other
parameters are less obvious.

Example "Aura" images
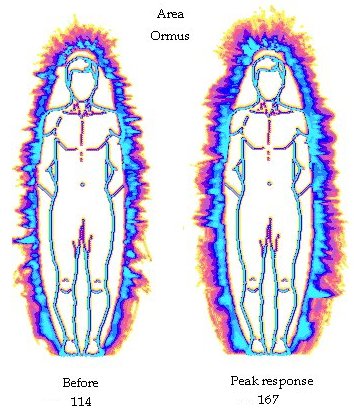
The examples above show the appearance when images from
all ten fingers are arranged around  a "manikin" so as to look like an aura.
The numbers at the bottom represent measured changes in area.
This is shown for the ormus response only.

The imformation from this type of image is digitized and run through a computer program for interpretation. The software allows quantitative analysis of a number of parameters, and so permits objective comparisons to be made.

I had been on a water-trap ormus preparation (Rhodium/Gold) [from Mountain Manna] for several months. In order to test my response I stopped taking it for 5 days, and then took a large dose (about 6x the recommended daily dose). GDV readings were taken just before, and at intervals after this dose.

Graph A
GRAPH A

In Graph A, the green line represents the area of the image averaged over all ten fingers. An increase in this quantity ("expansion of the aura") is most generally indicative of health. Light blue represents brightness: increase is a good sign if it is together with  increased area, but may indicate stress if it occurs at the expense of area. Dark blue represents fractality of the border, and red represents so-called "noise": the area of the image in fragments less than 30 pixels. Both of these should ideally be low. It can be seen that the response reaches maximum in about 5 hours, and then dies away by the next day.

Singlet Oxygen Therapy was developed by Tony Van der Valk (see his website http://www.polyvalk.com). Air passes first through water, so as to be saturated with water vapour, and then passes a red (634nm) LED that shines on a phthalocyanine compound. This catalyses the conversion of atmospheric oxygen to the extremely reactive singlet oxygen. The singlet oxygen immediately donates its energy to the water vapour, which can then be breathed through a loose nasal cannula.   The energy is of a grade high enough (about 1 eV) to generate light in the body. None of the usual biochemical reactions can reach such an energy. It thus performs the same function as the other Oxygen Radicals, which are obtained normally with negative ions, UV light, etc., and can be therapeutically supplied by ozone, hydrogen peroxide, etc. Tony Van der Valk's method is, however, more effective, more convenient and safer than these last.  The question of the essential function of  Oxygen Radicals has been thoroughly researched by Prof. Vladimir Voekov (V.L. Voekov and V.L. Naletov: "Weak Photon  Emission of Non-Linear Chemical Reactions of Amino Acids and Sugars in Aqueous Solutions". 1998 . In Biophotons: J.-J. Chang, J. Fisch and F.-A. Popp Eds. Kluwer Academic Publishers. Dordrecht pp. 93-108) and the fundamental role of light energy in the maintenance of quantum wholeness in the living organism has been researched by Dr Fritz Popp, and many other authors over the last thirty years (see Dr Mae-Wan Ho's excellent book "The Rainbow and the Worm", World Scientific, 2nd Ed. 1998).

I have been taking Singlet Oxygen Therapy (15 min twice per week) for about two years, with considerable benefit to my energy. The GDV test was done after 6 days without taking it. After the initial reading, I took a 20 min treatment, and then took further readings at intervals.

Graph B
GRAPH B

Graph B (on singlet oxygen) shows a good response, similar to Graph A, except that the peak and subsequent decline were reached somewhat earlier.

I suggest that these therapies may be mutually complementary. Thus one may require sufficient superconductivity in the system before the light energy can be properly utilised. It may be relevant that considerable light energy is known to be stored in the living organism in the form of electronic excitations, and that Fritz Popp has evidence that it is mostly stored in the DNA.


Following are Roger Taylor's responses to the Survey for "Regular (self-defined) ORMUS users", self-assessed:

My ormus usage is:
1.  trap water

By Regular I mean:
1.  Daily

My overall physical health is:
2.  good

My infectious disease occurrences are:
2.  Rarely - but on the rare occasion when I get a cold I have a lung infection.

My level of degenerative type disease for my age is:
2.  Very few degenerative diseases, compared to others my age. Age 73: chronic bronchitis of 8 years standing.

My overall physical health since becoming a "regular ormus user" has:
2.  Somewhat improved

Please add any significant comments:
My energy had already been restored before starting ormus, due to taking singlet oxygen therapy for 2 years. Otherwise I might have seen more response to ormus.